Diriyah - Event Performance Dashboard (B2B)
Overview
Diriyah Company runs large-scale retail and promotional events supported by multiple digital touch points interactive retail screens, sales apps, and registration tools. However, there was no unified way to track performance across these digital applications or measure how events were contributing to lead generation and marketing outcomes. Data existed but it was fragmented across platforms and difficult to interpret.
The Challenge
The client needed:
A single source of truth for event performance
Clear visibility into digital application usage during live events
The ability to compare events historically
Insight into lead quality (not just volume)
A way to connect event investment with marketing outcomes
There was no structured way to answer fundamental questions like:
Which events generated the most Marketing Qualified Leads (MQLs)?
How do conversations translate into qualified leads?
Which digital touch points drive the highest engagement?
Are interactive retail installations actually converting interest into leads?
My role : Lead Product Designer
Product discovery with stakeholders from different teams (Brand , Events, Development and Destination)
Definition of KPIs (Key Performance Indicator) and data hierarchy ,
What are we actually measuring to define success?Information architecture and dashboard structure.
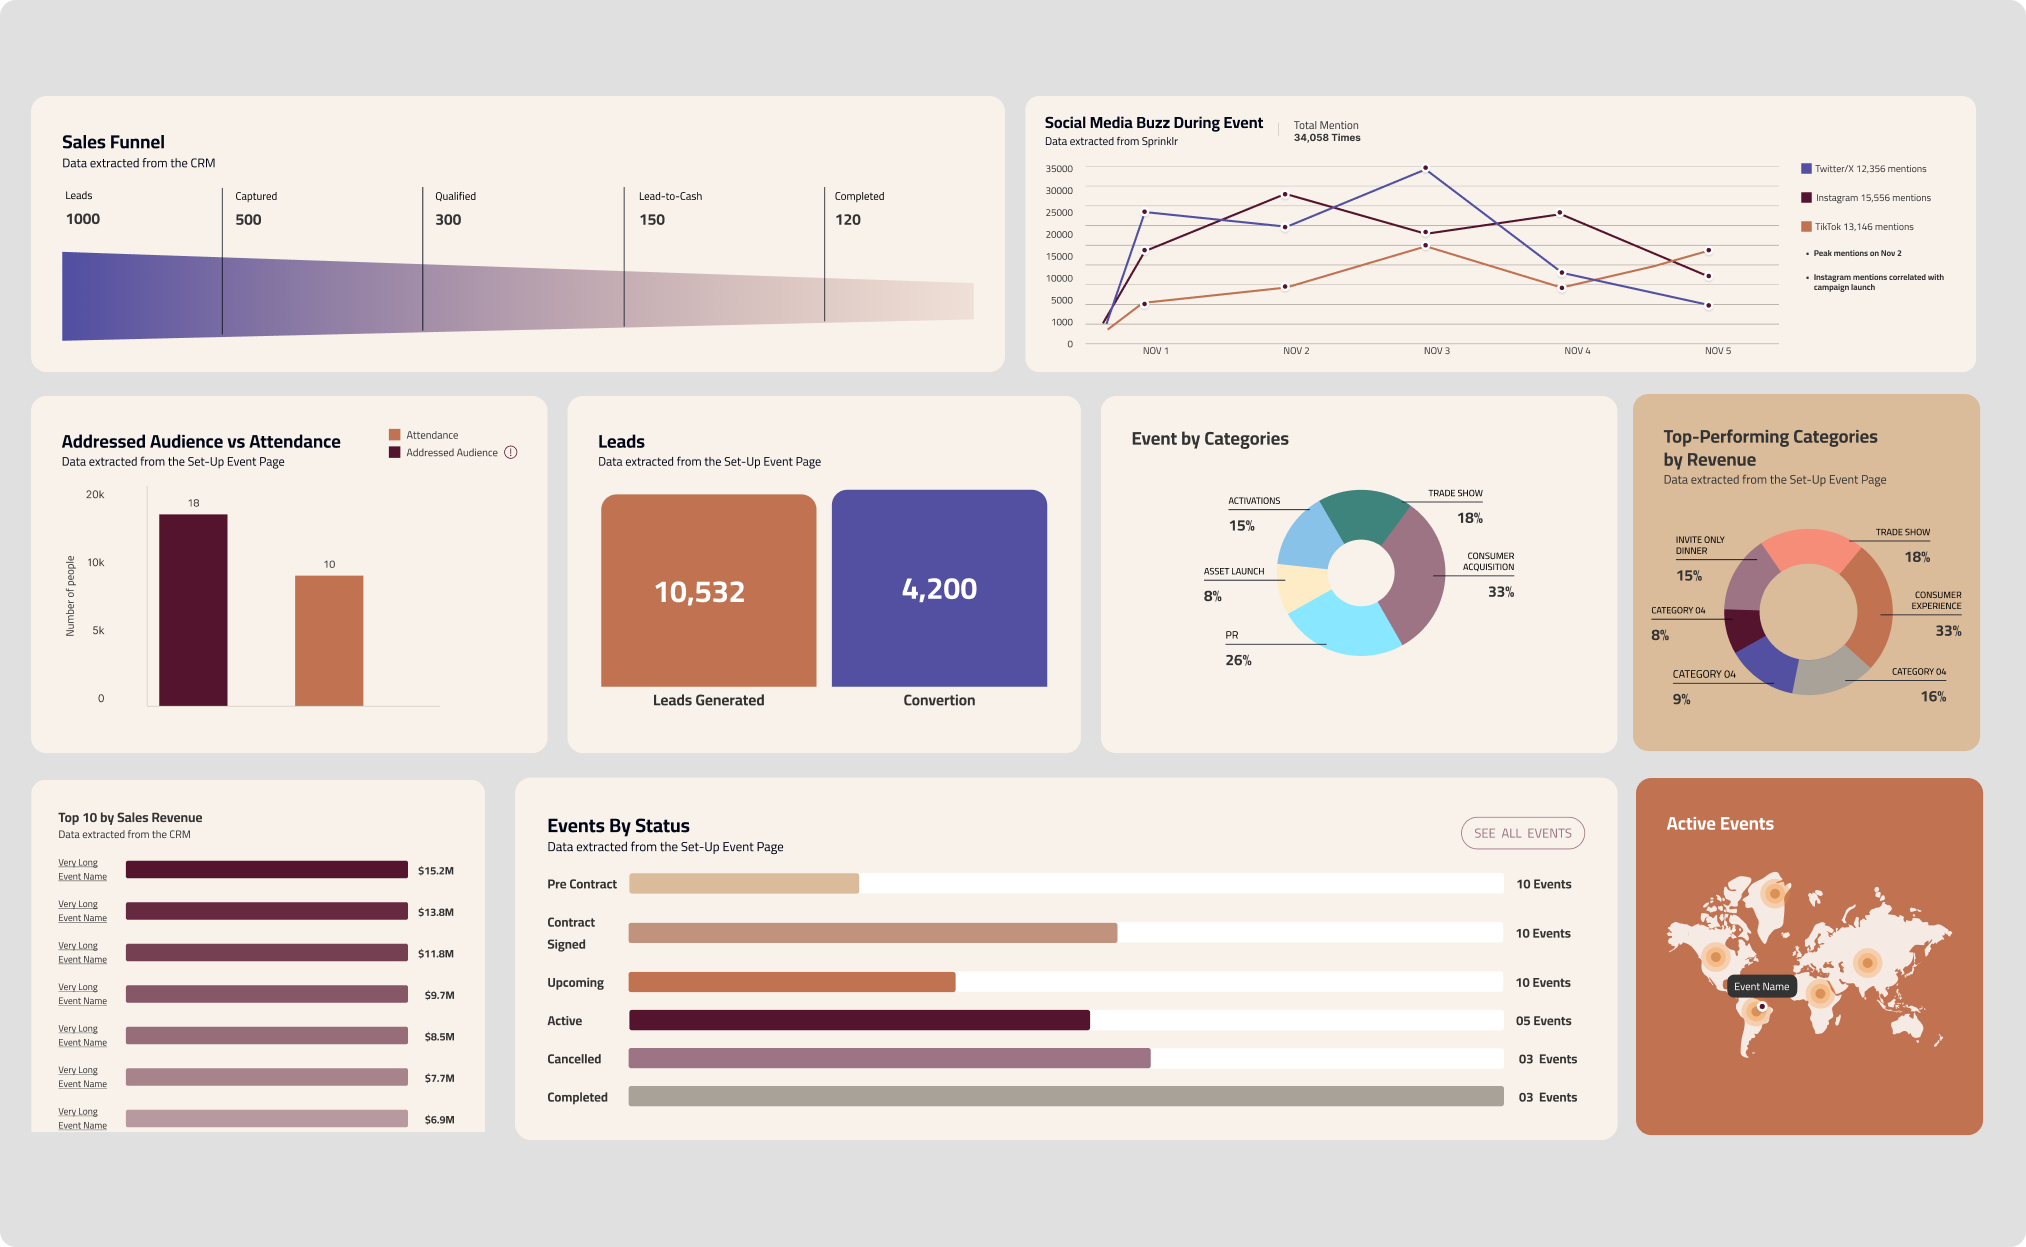
Designed modular dashboard components adaptable to different metrics and business needs.
Worked with engineering to establish robust data logic, validate how metrics were calculated.
The Solution
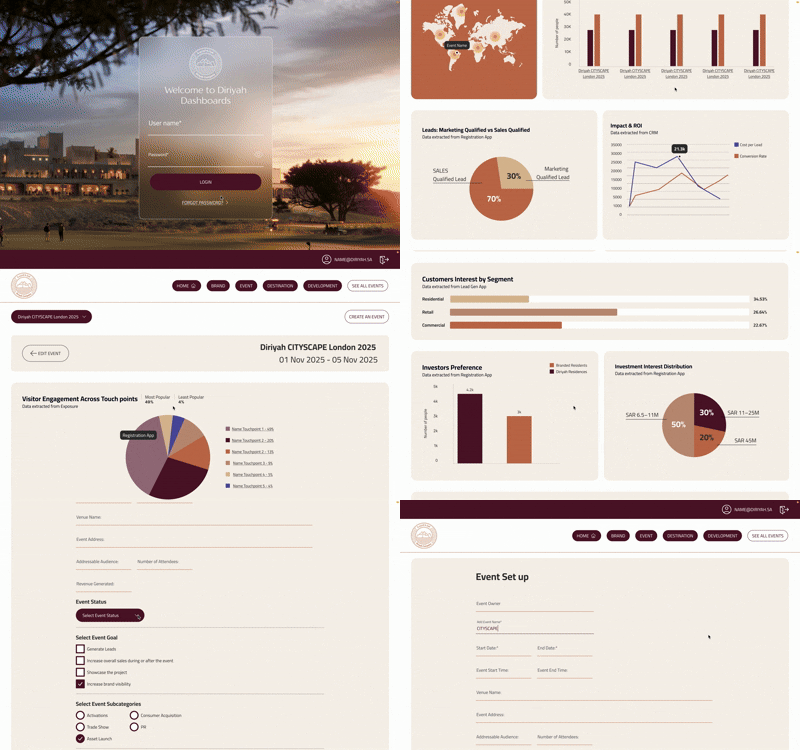
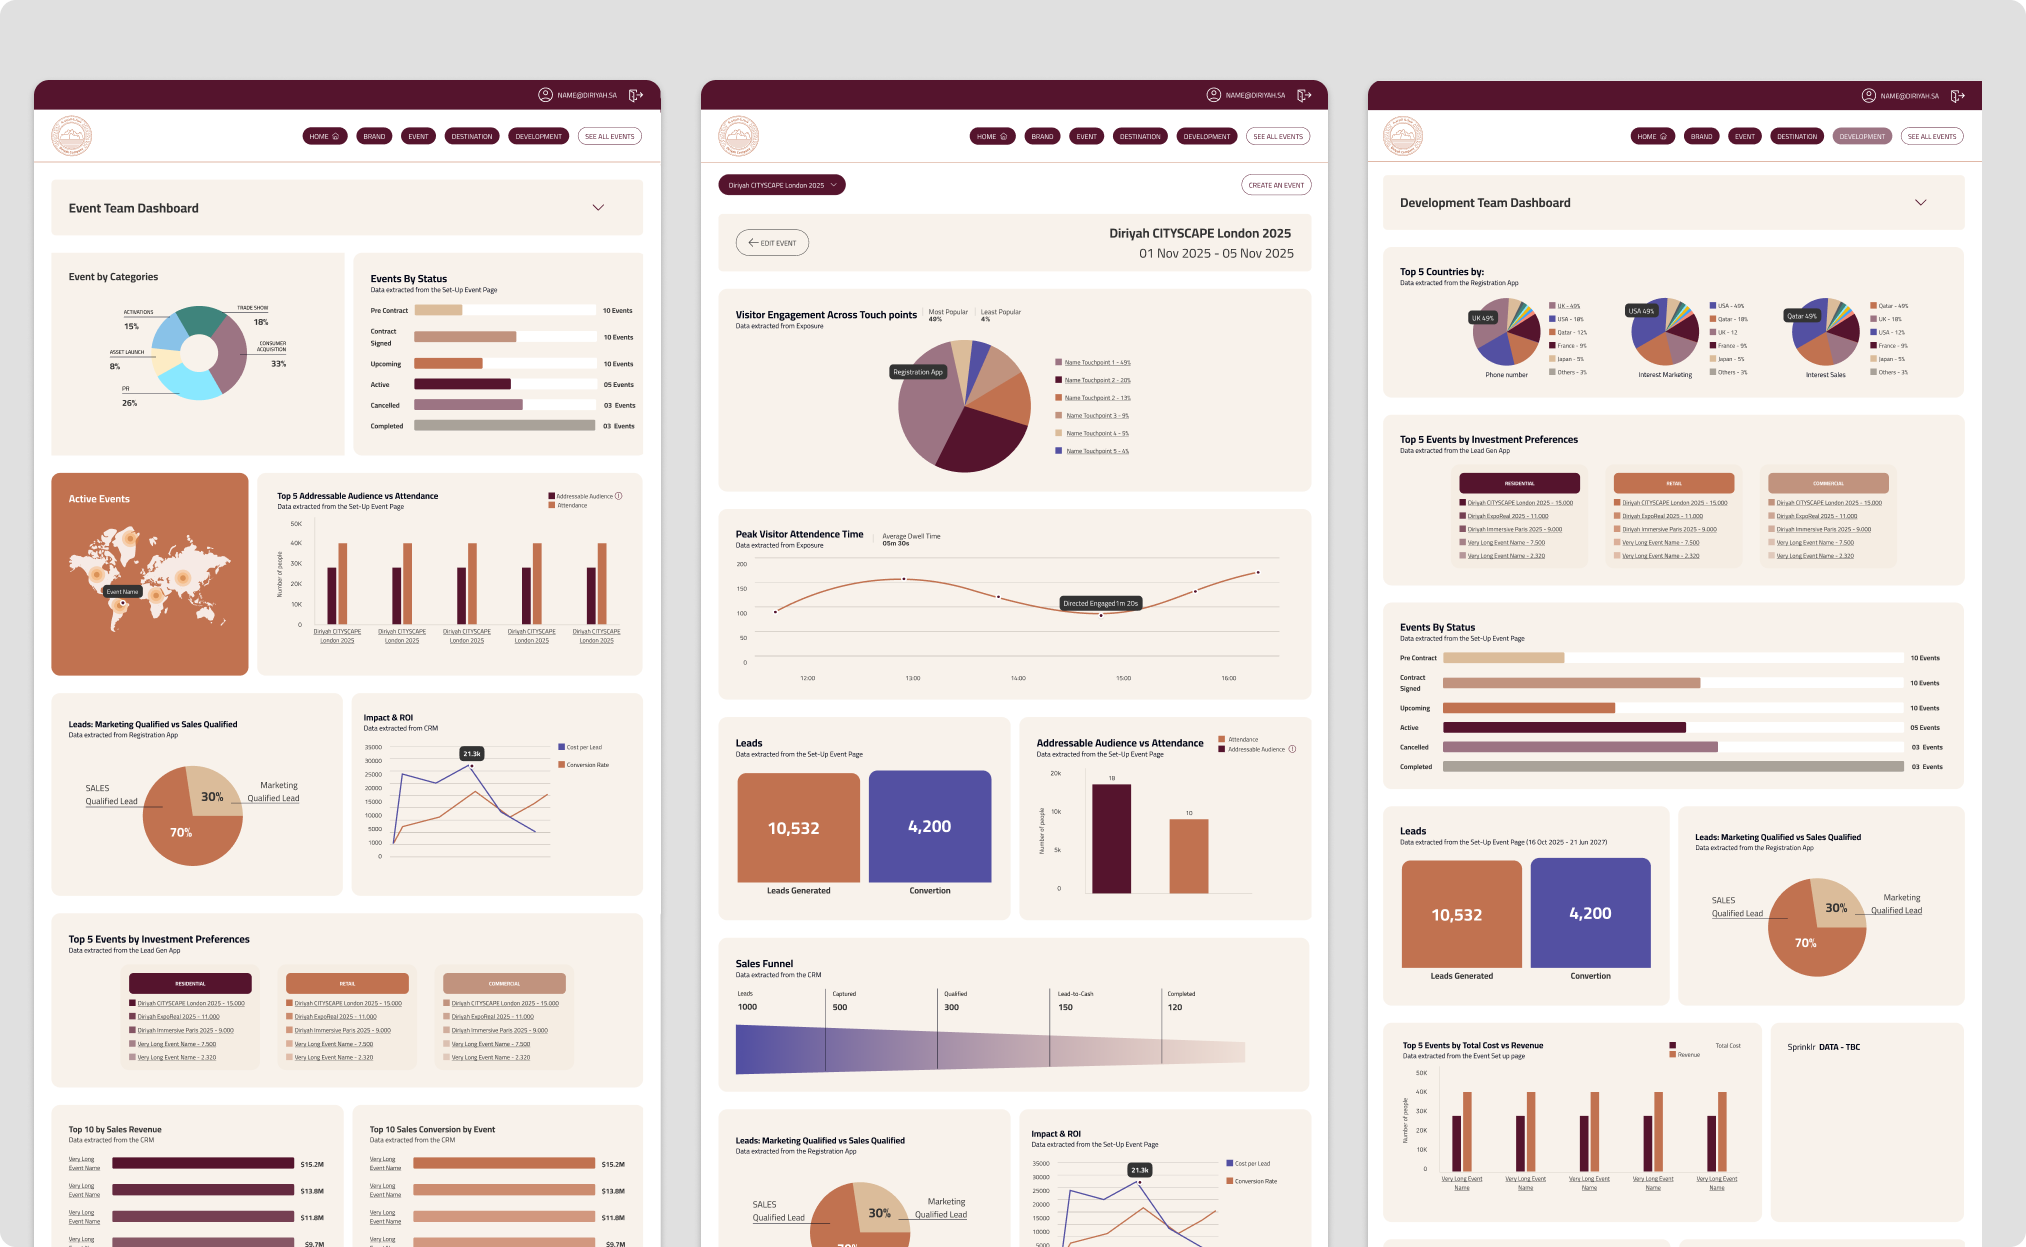
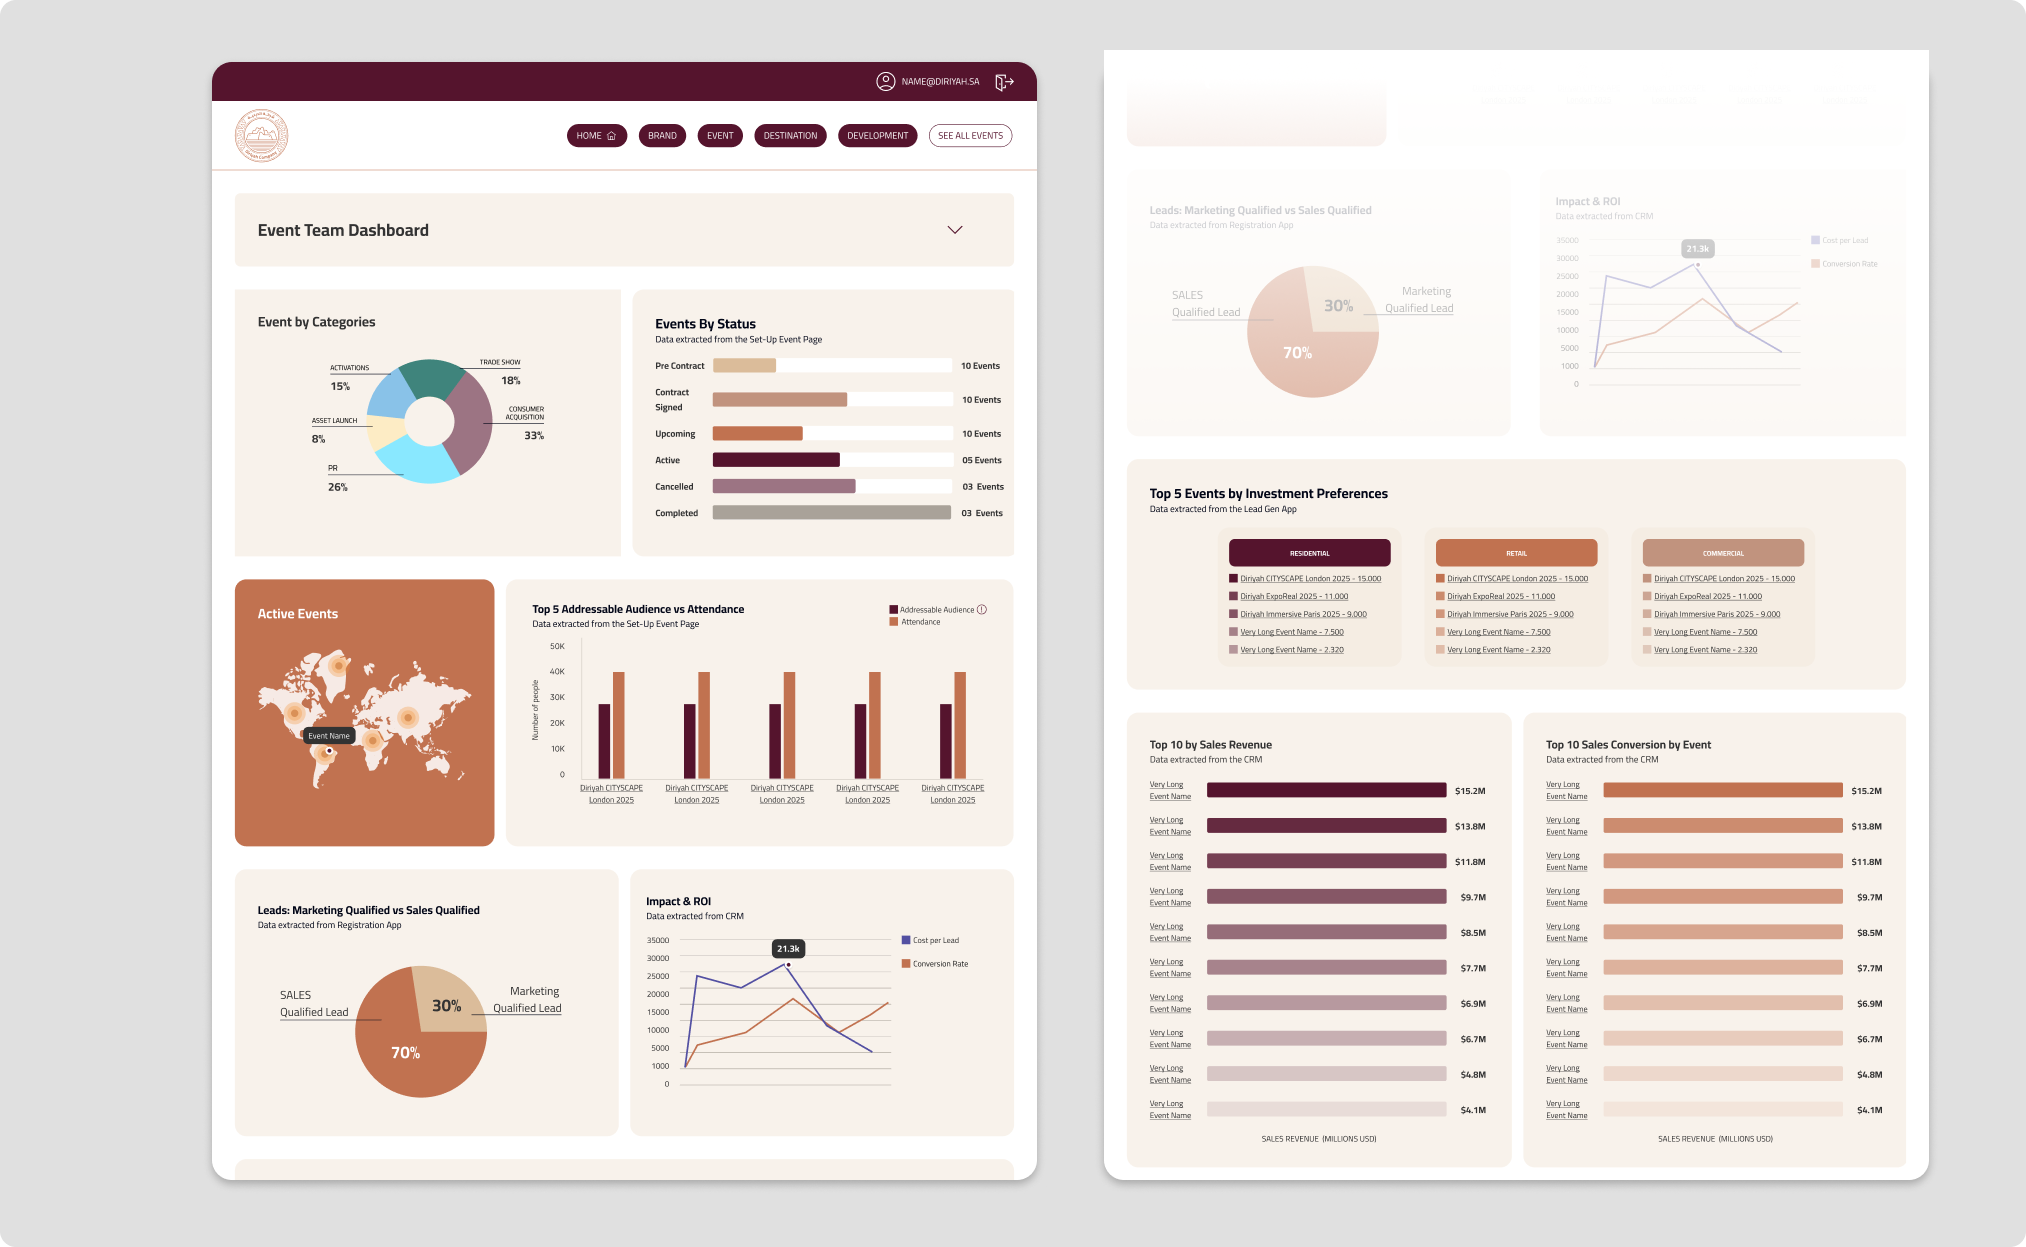
We designed and delivered a Web/Desktop Platform that consolidates data from all digital touch points into one unified dashboard for all different teams (Brand , Events Development and Destination)
Core Features
Compare current vs past events
Identify trends in lead quality
Evaluate seasonality and format performance
Benchmark future event planning
Total Leads vs Marketing Qualified Leads (MQLs)
Conversion rates
Engagement by digital touchpoint
Event investment vs output
Data Sources : Event Set up & Digital Touch Points
Event Setup & Configuration
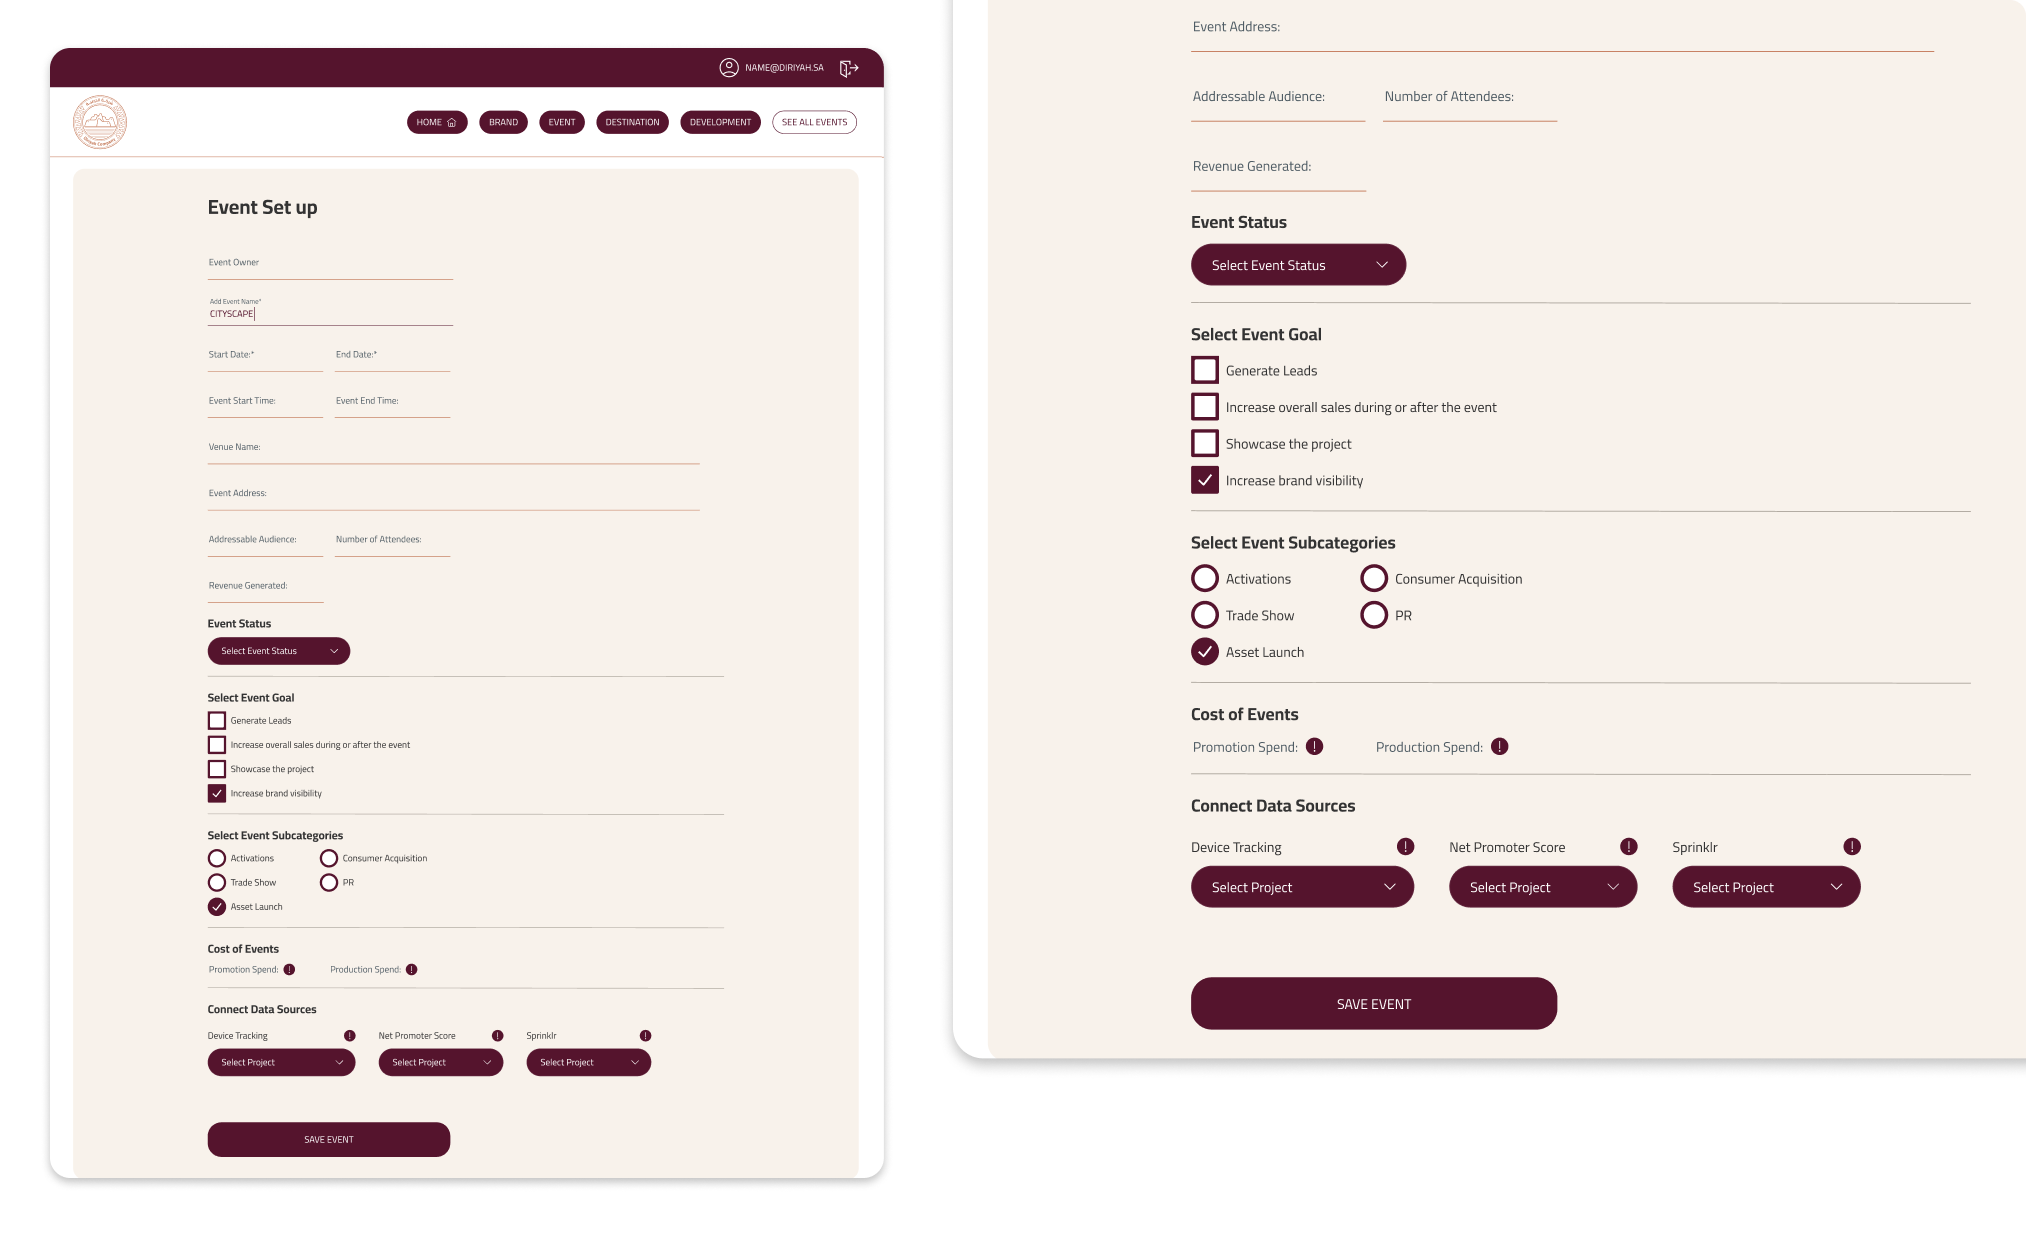
Defining the start and end dates
Specifying the addressable audience and expected number of attendees
Setting and updating the event status (e.g. upcoming, active, completed)
Selecting the event objective (lead generation, brand awareness, sales, etc.)
Assigning the appropriate event category
Inputting the event investment / cost
Enabling integrations with external platforms (e.g. social media connectors such as Sprinklr)
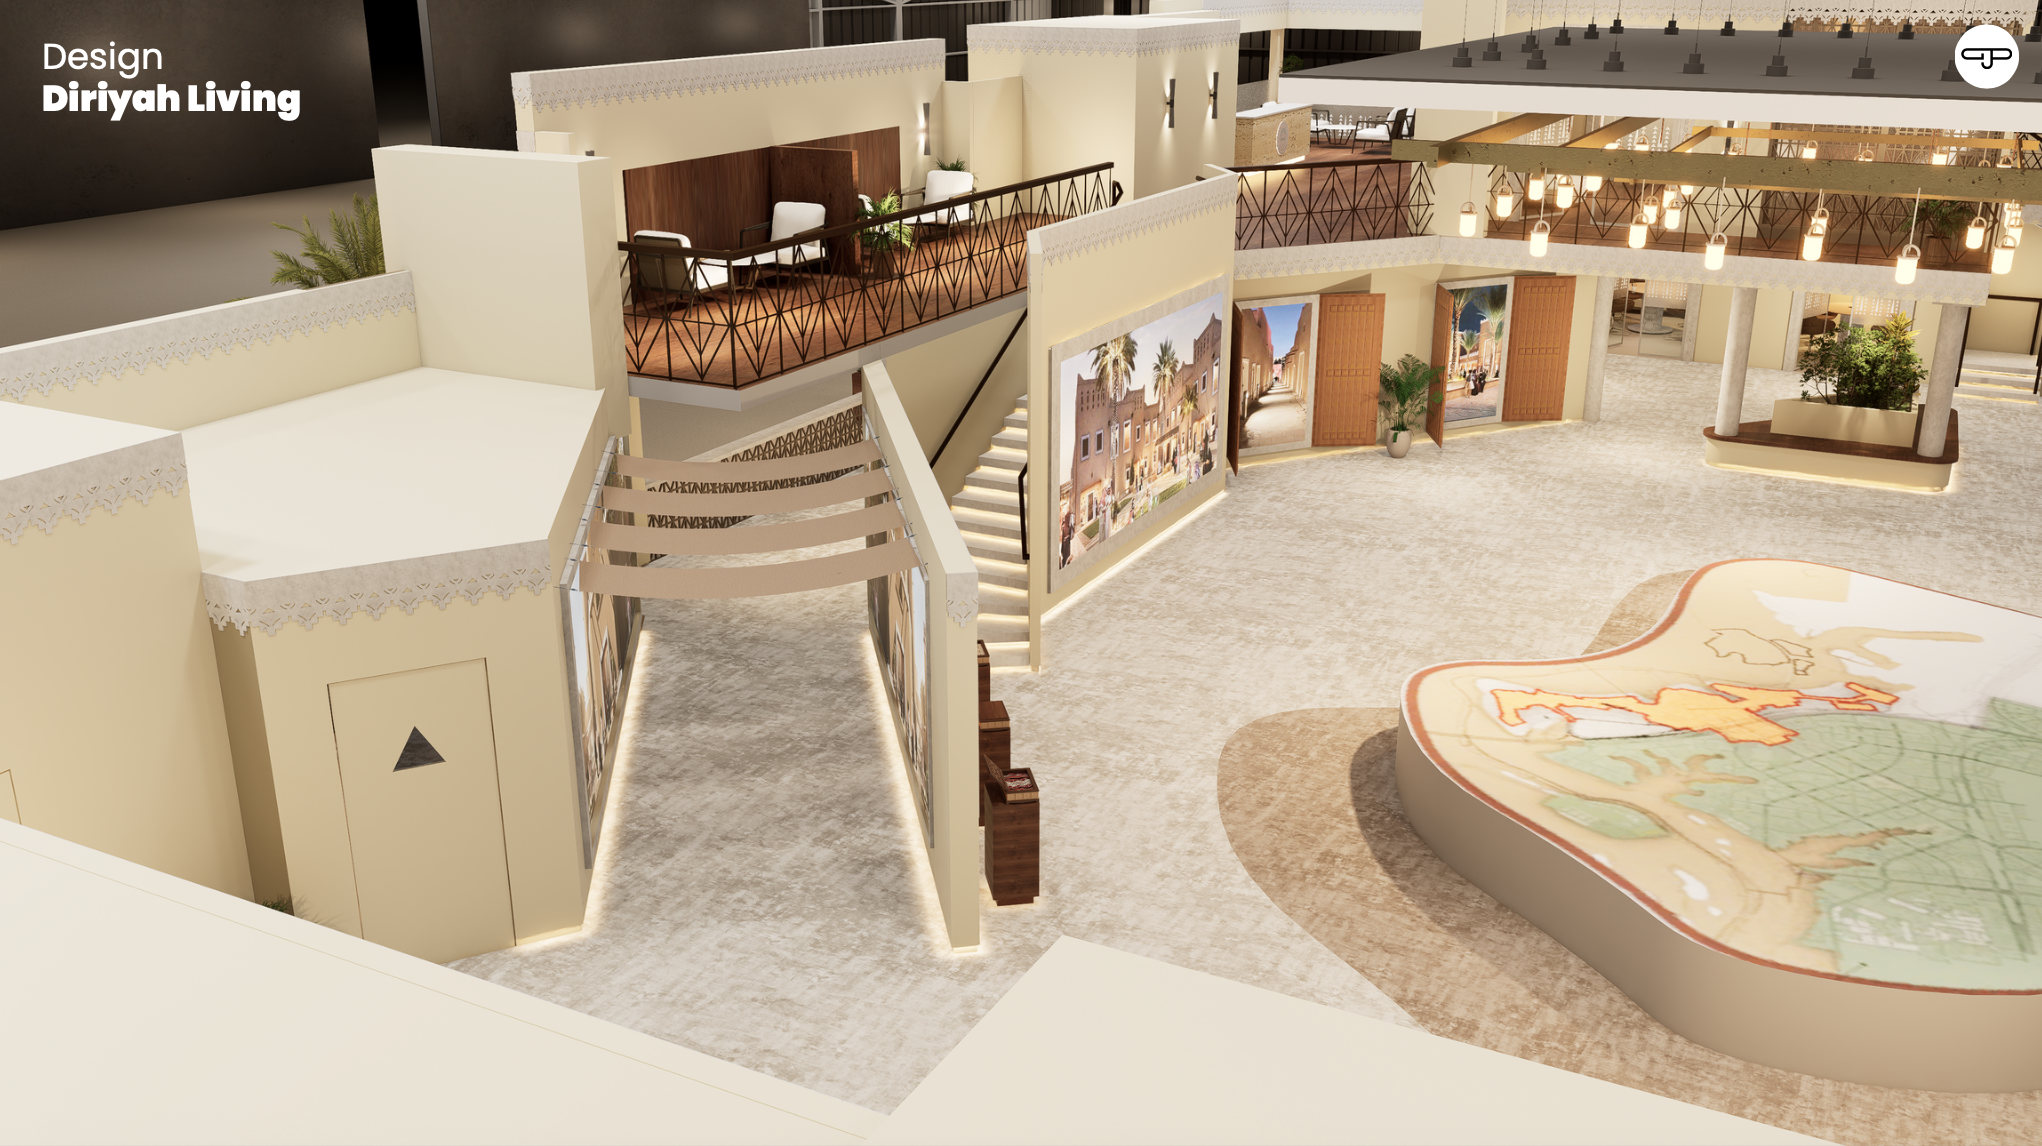
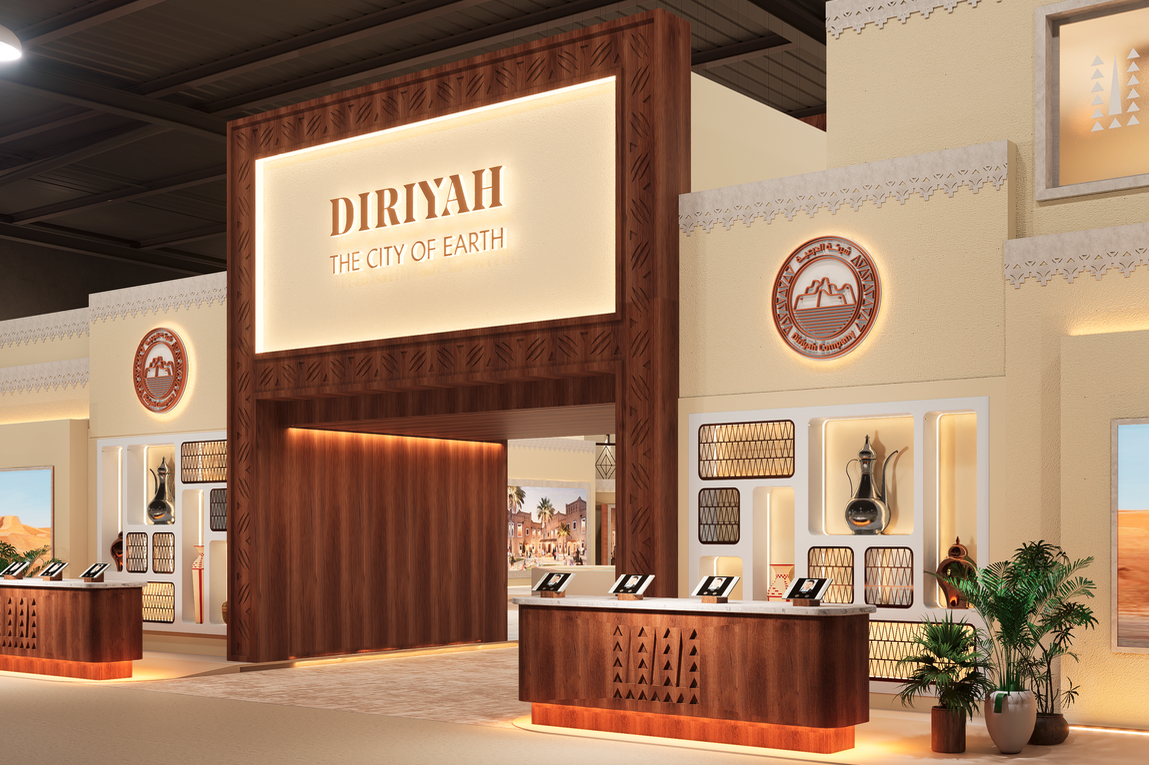
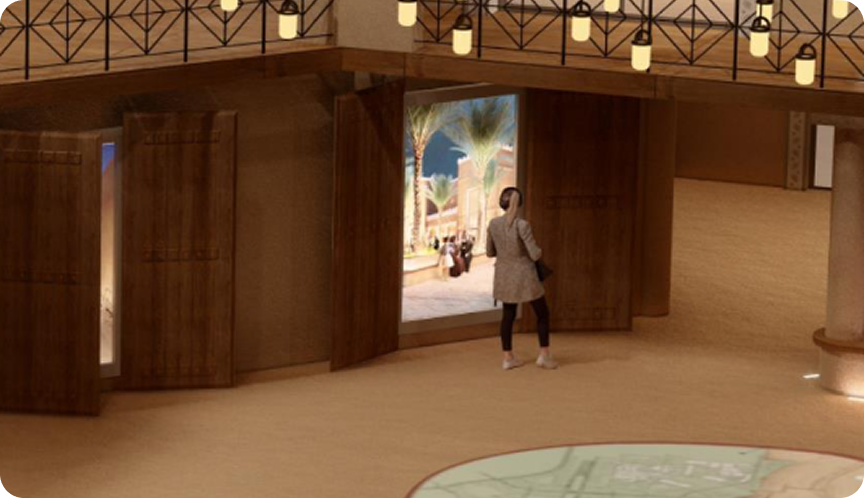
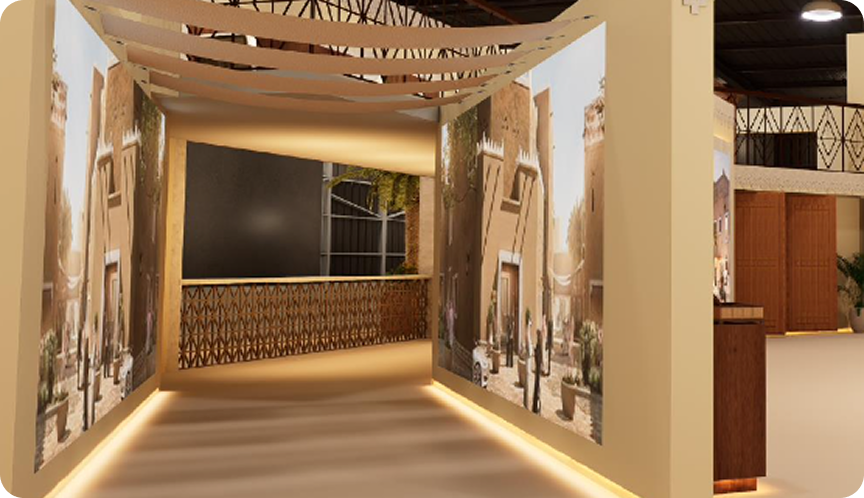


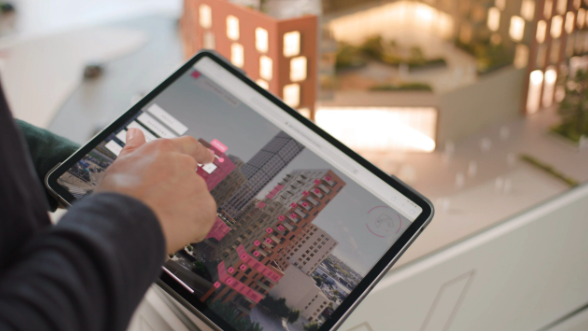
All digital touchpoints across events where data is captured.
Interactive retail screens where visitors explored Diriyah developments
Sales Force mobile & tablet apps used to capture leads and book meetings
Event registration app capturing attendee data
Designed modular dashboard components adaptable to different metrics and business needs.
Impact
The platform transformed event reporting from reactive spreadsheets into a proactive decision-making tool.
Clear alignment between Marketing and Sales
Better understanding of lead quality vs volume
Data-driven investment decisions
Improved accountability across digital touchpoints
Faster post-event reporting
Design Challenges & Strategic Thinking
Designing for multiple stakeholder types (executive vs operational users)
Simplifying complex datasets without oversimplifying insights
Defining meaningful KPIs where none previously existed
Creating a scalable framework to accommodate future digital tools
This project required strong systems thinking ensuring that multiple apps (retail touch point screens, sales app, registration app) could be understood as one ecosystem rather than isolated tools.